See where your AI visibility program is moving — and where it's stuck.
Prompt Analytics gives you the trend view across your entire monitored prompt library: citation rate trends per platform, fix type distribution across diagnosed gaps, recommendation pipeline throughput, and intent-to-citation conversion. Six dashboard charts, time-range controls, and per-platform breakdowns.
Available on Pro + Diagnose and above
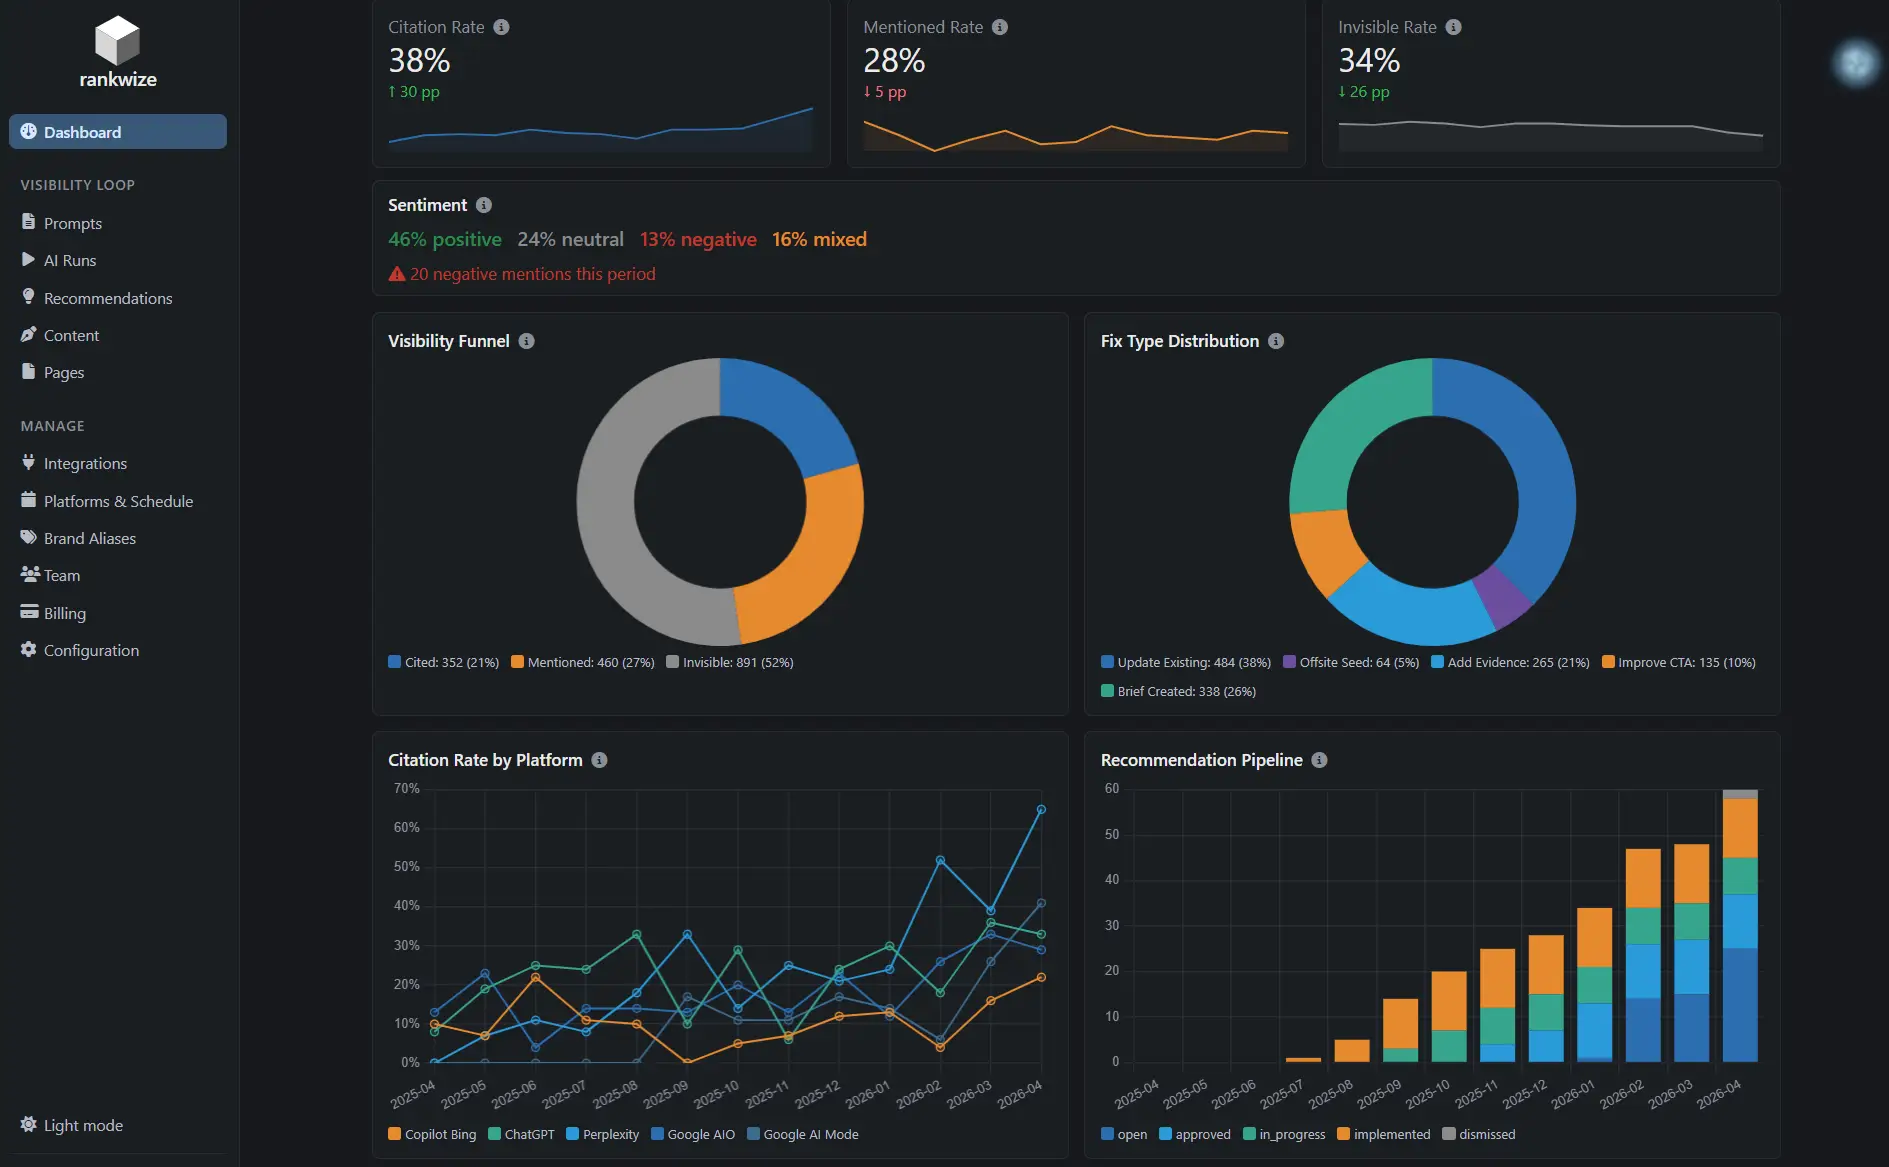
Six dashboard charts.
Prompt Analytics surfaces six charts across your prompt library.
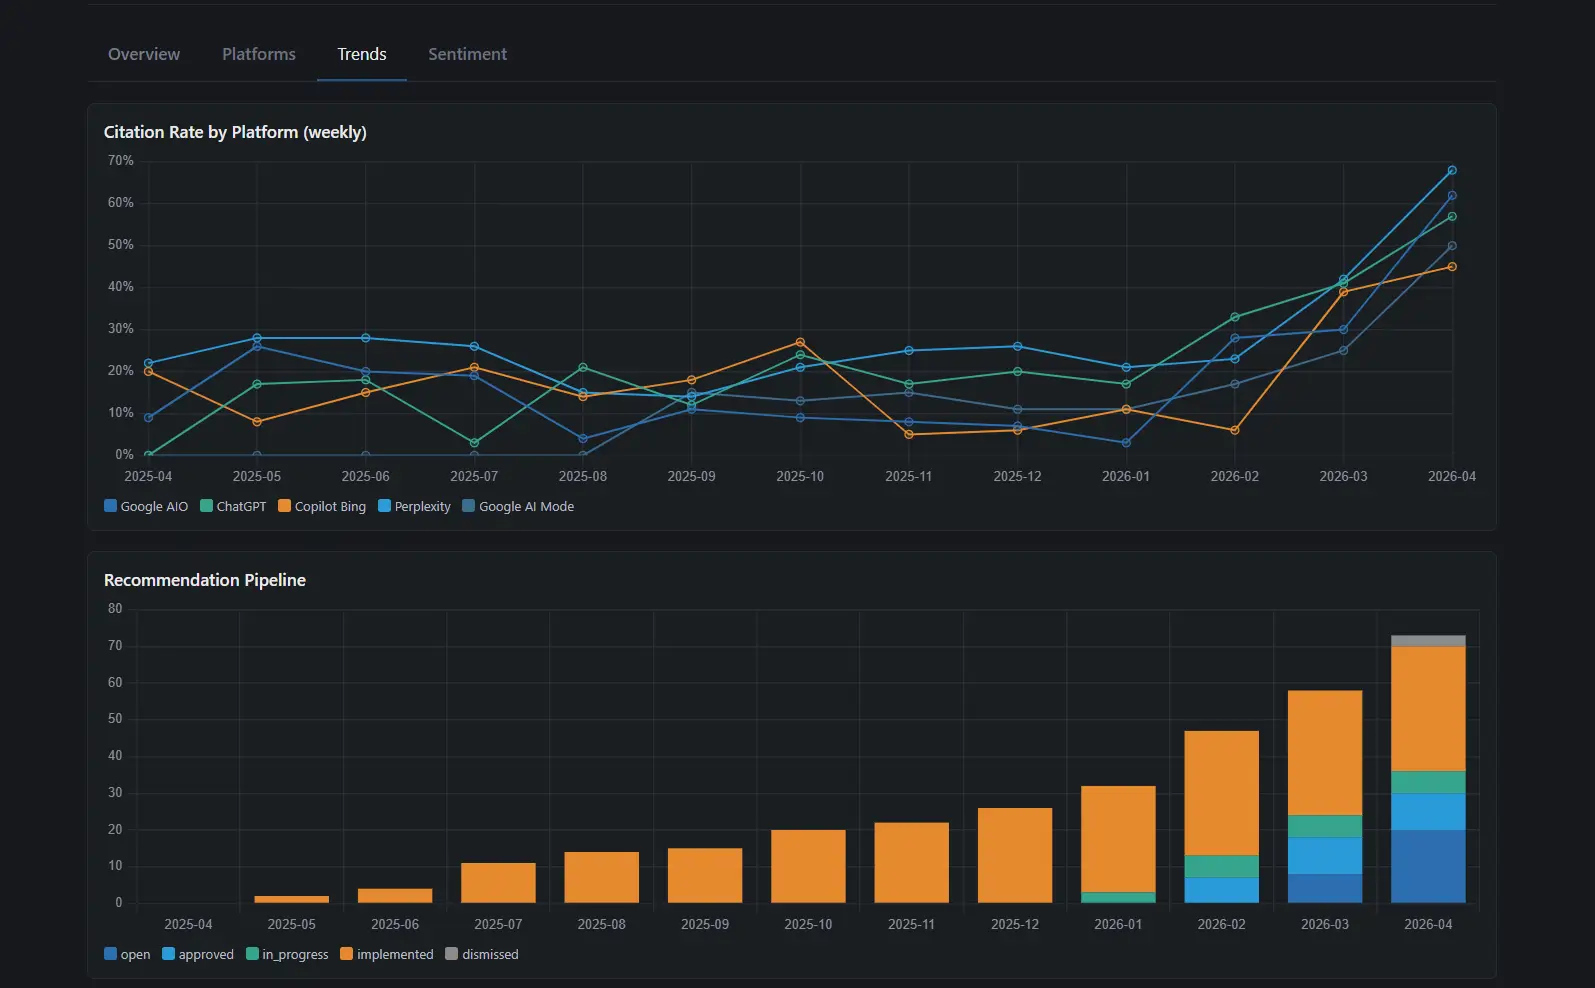
Citation Rate by Platform
Citation rate trended over time, with a separate line per AI engine. Time range controls adjust automatically: daily data for short windows, weekly buckets for medium ranges, monthly for long-term trends.
Visibility Funnel
Breakdown of your prompts by outcome: cited, mentioned (brand appeared but not linked), and invisible. Shows the current distribution and trend over the selected time range.
Fix Type Distribution
How your diagnosed gaps break down across the seven fix types. Update Existing and Add Evidence are typically the largest categories. The distribution shifts as you implement recommendations and content gaps close.
Recommendation Pipeline Throughput
How many recommendations moved from Open to Approved to In Progress to Implemented over the selected period. Identifies bottlenecks in your team's implementation workflow.
Intent-to-Citation Conversion
Of the prompts you've activated, what percentage have achieved at least one citation since activation? Broken down by intent category: informational, commercial, comparative, diagnostic.
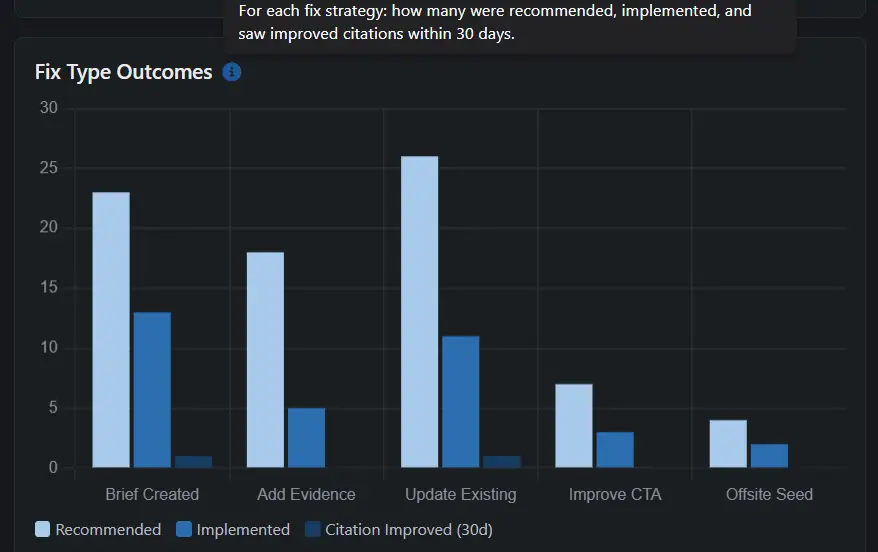
Fix Type Outcomes
Of implemented recommendations by fix type, what percentage resulted in a citation improvement on the next monitoring cycle? Surfaces which fix types are working for your tenant and which aren't.
Prompt Analytics dashboard — time range selector adjusts granularity automatically across all six charts.
Time range controls.
All six charts share the same time range control. Selecting a range adjusts the granularity automatically — you don't configure it. The system picks the bucket size that gives a readable trend line for the selected window.
Per-platform toggles on Citation Rate by Platform let you isolate any single engine or compare two platforms side by side. The visibility funnel and fix type distribution charts are aggregate by default.
What to watch for.
Fix type distribution shifting toward Update Existing
Your content library is aging relative to what AI engines currently cite. The right response is a freshness pass across your highest-priority matched pages.
Recommendation pipeline throughput lower than new recommendations added
Your team is adding diagnosed gaps faster than implementing fixes. Review the In Progress → Implemented bottleneck: is it a team capacity issue or a brief quality issue?
Intent-to-citation conversion below 40% on commercial prompts
Commercial-intent prompts are the hardest to win and the most valuable. Below 40 percent suggests a systematic gap in evidence strength or CTA alignment, not isolated individual page problems.
Fix Type Outcomes showing low effectiveness on a specific fix type
The same signal the Fix Type Effectiveness score uses to adjust future recommendations. Prompt Analytics surfaces the trend before the automatic adjustment kicks in.
How it works
Monitor
Every monitoring cycle produces citation outcomes, recommendation assignments, and implementation status updates.
Aggregate
Prompt Analytics rolls up results across your full prompt library by platform, fix type, intent category, and time range.
Trend
Charts surface how your program is performing over time — where citation rates are improving, where gaps are compounding, and which fix types are working for your tenant.
Prompt Analytics aggregates data from every feature in the Rankwize platform — monitoring runs, Diagnose outputs, and Impact Tracker attribution.